Data Visualization Concept
Author: Julian
Category: Data Visualization
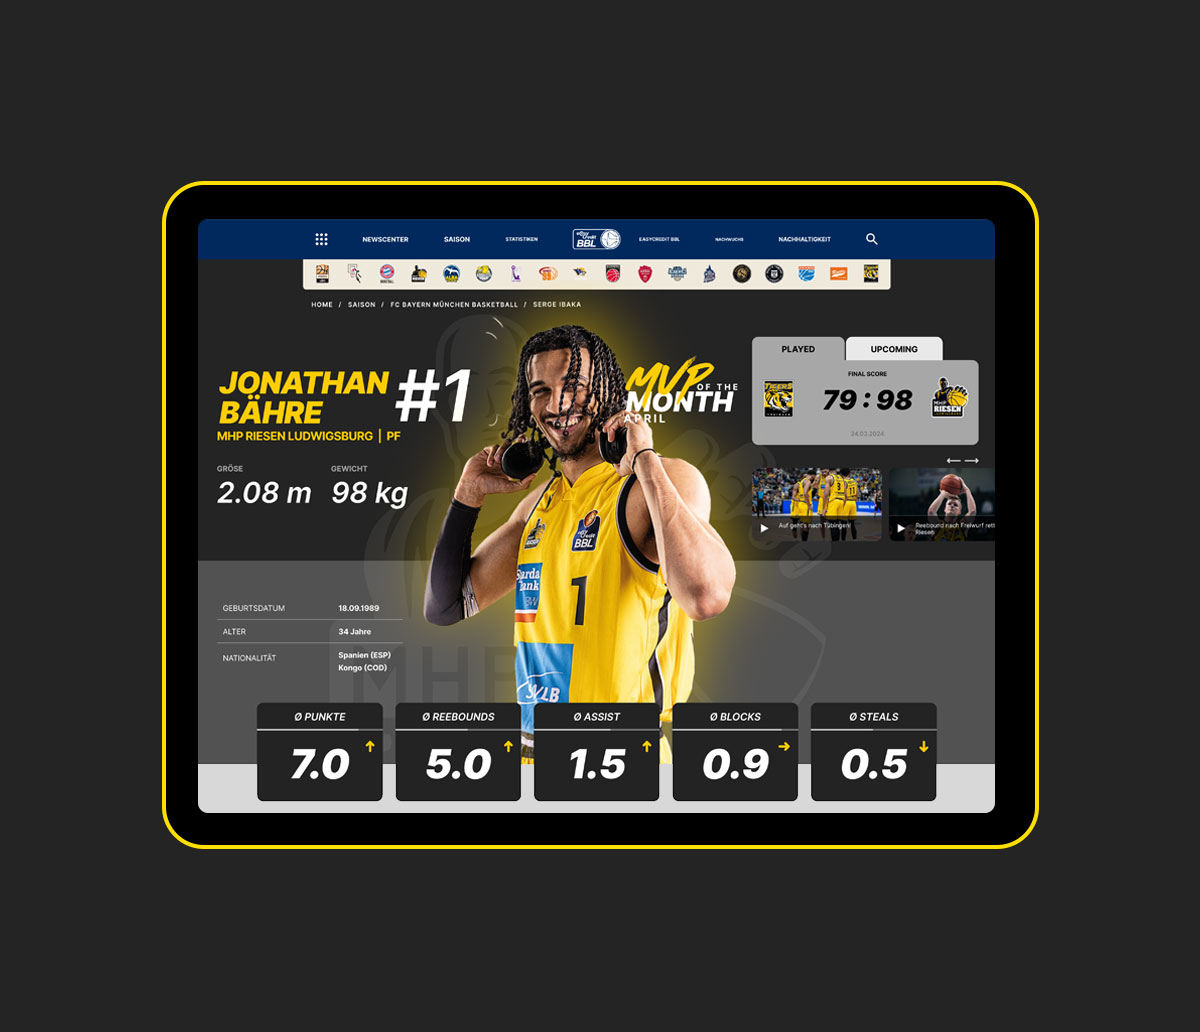
Get in the Game:
Explore BBL Stats Like Never Before.
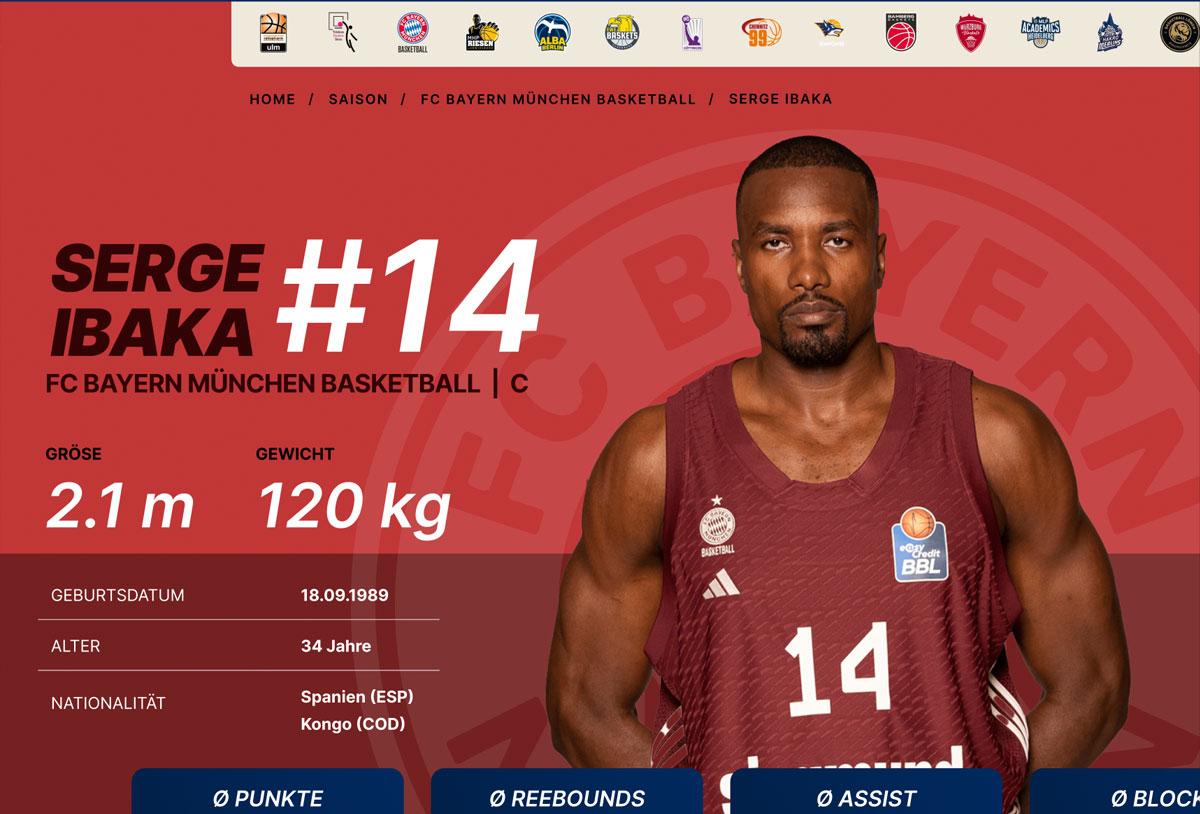
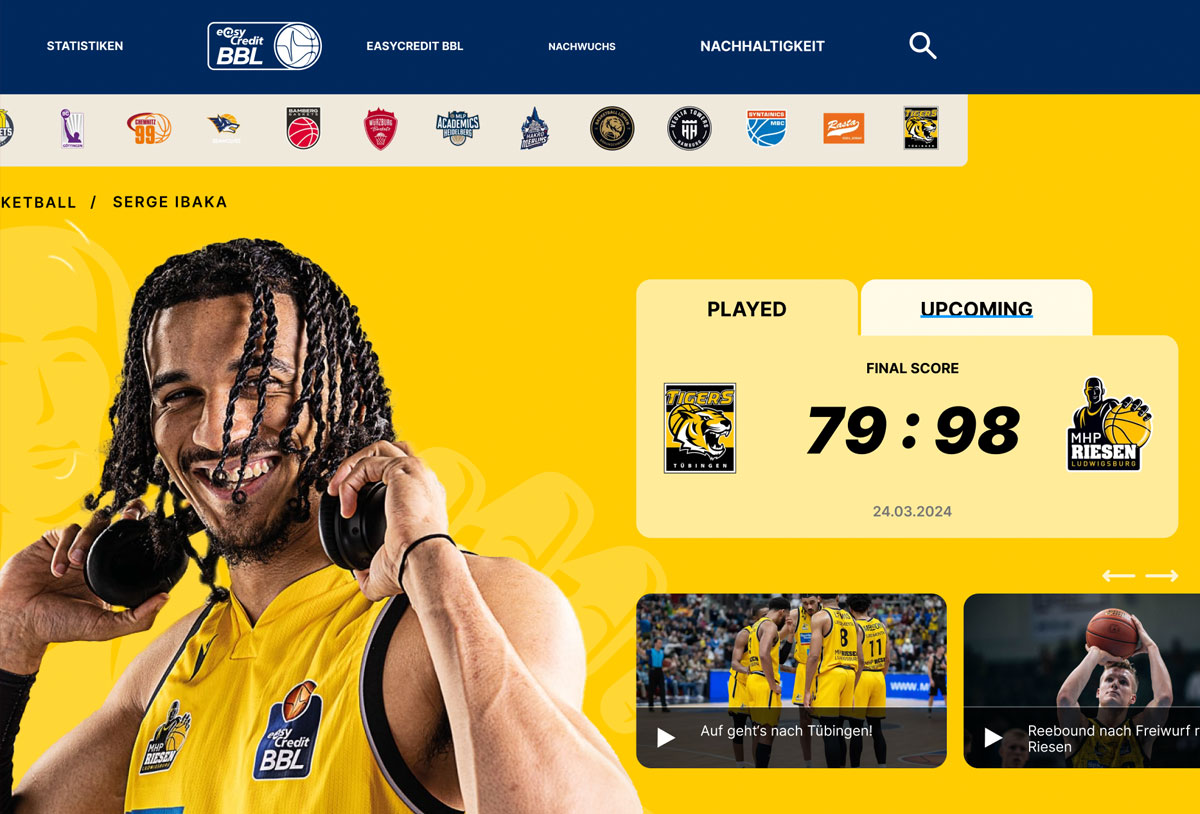
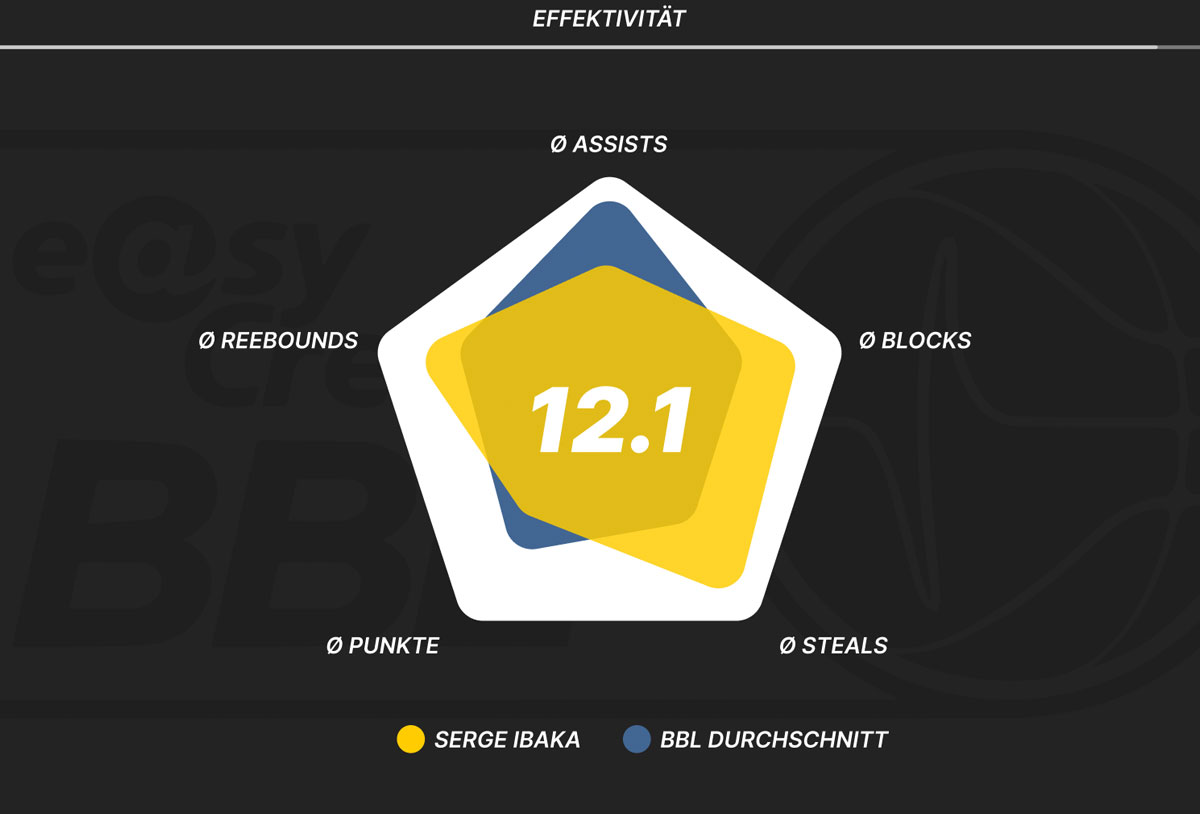
Basketball is a data-rich sport, and fans are hungry for stats on their favorite players and teams. To elevate the fan experience, we designed an interactive data visualization concept for the BBL’s website, providing a visually engaging way for fans to explore game stats, player performance, and team rankings.
Our approach was to make complex data easily accessible and fun to interact with. By creating an intuitive layout and using dynamic visuals, we wanted to allow fans to dive into real-time stats, compare player metrics, and track season progress effortlessly. This design not only should enhance user engagement but also the make BBL’s data more accessible to all fans, whether they are casual viewers or die-hard stat enthusiasts.